Here’s the situation: You’re doing a big data analysis in your Jupyter Notebook. You’ve got tons of charts and you want to report on them. Ideally, you’d create your final report in the Jupyter notebook itself, with all its fancy markdown features and the ability to keep your code and reporting all in the same place. But here’s the rub: most people still want Word document reports, and don’t care about your code, reproducibility, etc. When reporting it’s important to give people the information in a format most useful to them.
So you’ve got tons of charts and graphs that you want to put in the Word report – how do you keep the two in sync? What if your charts change slightly (e.g. changing the styling of every chart in your report)? You’re stuck copying and pasting charts from your notebook, which is a manual, time-consuming, and error prone process.
In this post, I’ll show you my solution to this problem. It involves the following steps:
- Saving the chart images from Jupyter Notebook to your desktop in code.
- Preparing your Word Document report, referencing the image names that you saved in your desktop in the appropriate location in your report.
- Loading the images into a new version of your Word Document.
Saving Chart Images from Jupyter Notebook to your Desktop
The first step is to gather the images you want to load into your report by saving them from Jupyter Notebook to image files on your hard drive. For this post, I’ll be using the data and analysis produced in my “Lets Scrape A Blog” post from a few months ago, where I scraped my favourite blog Marginal Revolution and did some simple analyses.
That analysis used matplotlib to produce some simple charts of results. To save these images to your desktop, matplotlib provides a useful function called savefig. For example, one chart produced in that analysis looks at the number of blog posts by author:
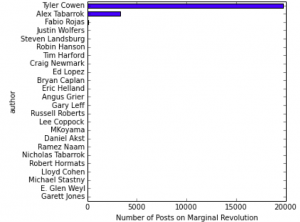
The following code produces this chart and saves it to a file named ‘num_posts_by_author_plot.png’ in the folder ‘report_images’.
https://gist.github.com/marknagelberg/8bf83aedb5922a325cd673dec362871e
A few pointers about this step:
- Make sure you give your images useful, descriptive names. This helps ensure you place the proper reference in the Word document. I personally like following the convention of giving the plot image the same name as the plot object in your code.
- Your images must have unique names or else the first image will be overwritten by the second image.
- To stay organized, store the images in a separate folder designed specifically for the purpose of holding your report images.
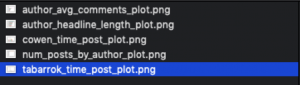
Repeating similar code for my other charts, I’m left with 5 chart images in my report_images folder:
Preparing the Word Document Report with Image References
There is a popular Microsoft Word document package out there for Python called python-docx, which is great library for manipulating Word Documents with your Python code. However, its API does not easily allow you to insert an image in the middle of the document.
What we really need is something like Jinja2 for Word Docs: a packages where you can specify special placeholder values in your document and then automatically loads images in. Well, luckily exactly such a package exists: python-docx-template. It is built on top of python-docx and Jinja2 and lets you use Jinja2-like syntax in your Word Documents (see my other post on using Jinja2 templates to create PDF Reports).
To get images into Word using python-docx-template, it’s simple: you just have to use the usual Jinja2 syntax {{ image_variable }} within your Word document. In my case, I had six images, and the Word template I put together for testing looked something like this:
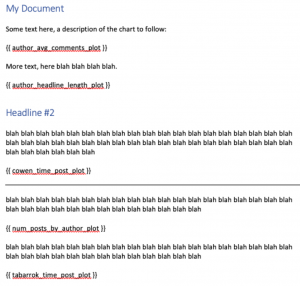
For the system to work, you have to use variable names within {{ }} that align with the image names (before ‘.png’) and the plot variable names in your Jupyter notebook.
Loading the Images Into your Document
The final and most important step is to get all the images in your template. To do this, the code roughly follows the following steps: load your Word document template, load the images from your image directory as a dict of InlineImage objects, render the images in the Word document, and save the loaded-image version to a new filename.
Here is the code that does this:
https://gist.github.com/marknagelberg/8895f9f60a3f696b4e24169f8134d33f
To run the code, you need to specify the Word template document, the new Word document name which will contain the images, and the directory where your images are stored.
python load_images.py <template Word Doc Filename> <image-loaded Word Doc filename> <image directory name>
In my case, I used the following command, which takes in the template template.docx, produced the image-loaded Word Document result.docx, and grabs the images from the folder report_images:
python load_images.py template.docx result.docx report_images
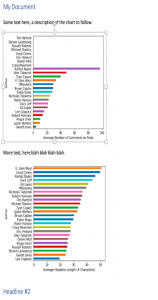
And voila, the image-loaded Word Document looks like this:
You can find the code I used to create this guide on Github here.