Author:: [[David Perrell]] and [[Patrick MacKenzie]]
Tags:: #marketing #writing #[[Audience Building]]
Overview: [[David Perrell]] and [[Patrick MacKenzie]] discuss various topics related to writing and promoting yourself online.
4:45You should think about how your writing is framed online if you are looking for it to be used to promote your commercial work. “Blogging” has a poor brand within many high status employers, whereas “memos” and “essays” do not. Try to categorize your writing as these things rather than a blog post. These small changes can make a big difference. Don’t call it a “blog”, don’t put a date on it if it’s not stuff that will decay in importance in 48 hours, choose to write about things that will stay relevant, etc. #blogging #promotion #Portfolio
9:00Try to create a tighter brand for your writing. Find a niche and try to focus on that, although experimenting isn’t that bad an idea, at least at first. Good to also think about your interests that happen to be booming in the economy (for example, [[Patrick MacKenzie]] focused on the intersection of [[marketing]] and [[engineering]]). #branding #niche
13:00Even if absolutely no-one reads your essay, it’s still worth writing it because it produces an asset you can use. For example, you could use it as a proof of work to a future employer and that would make it a tremendous ROI. Don’t feel like you have to have a big audience before [[writing]].
15:00find where people you are writing for hang out. Hang out there, and gradually inject your stuff in there. Gradually, and in an authentic way, introduce your thoughts into people’s with large following’s posts. Some people don’t get annoyed by this – some people with large followings actively signal boost.
23:40Benefits of long-form [[writing]]. A lot of the common advice about writing short-form on the internet comes from people with certain incentives for following that model (e.g. [[BuzzFeed]]). You really need to understand your personal [[goals]] and what the incentive structure are for achieving that goal.
28:30As soon as you put something on a dashboard, people start to change their behaviour based on what’s on that dashboard. So – be careful of what you put on [[dashboards]]. #KPIs #metrics
30:00Discusses the so-called “death of blogs”. [[Patrick MacKenzie]] points out that people that wrote blogs back in 2010 are still around, but now they have moved on to incredible titles, like CEO or Senior Staff Engineer at Google. As a result, they no longer blog or call themselves bloggers. #blogging
37:20 [[Patrick MacKenzie]] is a fan of [[Ramit Sethi]], he is one of his favourite marketers and knows how to do the internet well.
38:00Discussion of recommendations for email lists. Email is something you can own – it’s difficult to take that away from you. There’s also something powerful that someone put up their hand and said “yes, I want to hear, in my inbox, what you are talking about”. It’s also less “risky”, since no-one forwards a newsletter for someone else to dunk on it (unlike what happens on Twitter). #[[Email Lists]] #Independence #control
49:00Culture of [[Stripe]] and how they maintain a high level of craft. Are [[craft]] and [[metrics]] somehow opposed or a different language? Incentives matter – if you incentivize shipping the best version of something, that’s what you get. If you incentivize always meeting deadlines, that’s what you get. #incentives
54:35What does making writing at [[Stripe]] do for the company? 99% of their word count is internal. Some companies in hyper [[Growth]] mode are doubling their number of employees each year. As long as that continues, over half of your staff have less than 1 year experience with the company. Big problem is spinning people up to speed and getting them into the culture – “[[democracy of the dead]]” – people who were there before can have tremendous impact by producing highly leveraged artifacts, like written documents. Writing helps transfer knowledge #[[Corporate Knowledge]] #[[Organizational Memory]] #leverage
1:00:00When should you go to market after building an audience? [[Writing]] and developing an audience first before developing software is valuable because you build a list of people ready to buy. You also learn more about how to build a great product by writing deeply about it. The MVP for sellable word products is much lower bar than [[MVP]] for software. #[[Audience Building]]
1:07:30What is a small software business that you admire? How do they use online writing and content to grow and validate the business? There are tens of thousands of profitable, successful software / SAS business that you’ve never heard of. It will be boring, very successful, and will be sold, and hardly anyone that isn’t a customer or an employee will be aware of it. E.g. Moraware which provides software for kitchen counter installation companies.
1:14:00What is the 1 thing you think the [[US]] should import from Japanese [[culture]]? [[Earnestness]] and [[optimism]] of ones [[work]]. A non-ironic embrace of loving what you do. There’s a lot of [[cynicism]] in the US. “Choose to do what you love” is bad advice. Better advice is “Learn to love what you do”. #Japan #happiness
1:18:30How did you go from being a kid with “I want to be a baseball player” type interests to who you are now – an expert in niche SAS? People underestimate the ability they have to change, particularly the way they think. [[Stripe]] hires for people that are ambitious and optimist. Hanging around people like that makes you more ambitious and optimistic! #Ambition #optimism
1:23:00The amount of luck you have in life is how much value you create times how many people you tell about it. Explain what you mean by that. It’s a mistake to think that if you just do great work, you’ll be recognized for that. It’s a key professional skill and you should probably get good at it. #luck #marketing
2:18 shows his results from building his online presence – 3 people built it, 60 million impressions per month.
3:00 Main components of his stack: [[The Pomp Podcast]], [[The Pomp Letter]] (letter every weekday), [[Lunch Money]] (YouTube daily show). All of this is driven by [[Twitter]]. "Everything starts and ends with Twitter" – it’s a traffic engine for every other product and platform. #Ankified
6:42"Audience is the new currency". "Those who build the audience have the power."
8:30It’s hard to build an audience. You want to ask yourself what the value you want to create, what does the end result look like, and do you have the time / energy / dedication to attempt this? Comes down to man hours and time.
6 Principles for growing your audience #Ankified
Persistence is the most important thing (9:40). It takes time, and audience building starts slow. True for everyone, even those with huge followings. #persistence
Productize yourself (11:25). Every hour is something you can dedicate to a different product. Break up your day and optimize every hour – "how am I dedicating time to production of an asset that can be monetized later on?" What is your "[[Return on Attention]]"? #production #Productivity
Focus on one platform at a time (17:00). Benefits: 1) [[focus]] (how can I win on this platform and how can I be successful?) 2) if you grow the first platform it helps you build the second one, because you push people from your first platform to your new platforms. The big [[social media]] managers and influencers will often advise to do a whole bunch of platforms at once. When you don’t have the resources of [[Gary Vanyrchuk]] (had 15 people working for him on a holiday!) then it’s way better to focus on one platform and get good at that.
More content is better than less (22:25). [[Anthony Pompliano]] started out just Tweeting articles and pulling out the most relevant tidbit and just tweeting that, because he was unconfident and didn’t know what to Tweet about. People don’t listen to all your stuff. It’s like Netflix, give as much as possible and give the audience choice. More content means more people being interested in your content which means more followers. #[[idea generation]] #[[growth hacking]] #Twitter
Create once, publish 5 times (26:00). E.g. podcasts – publish as audio, publish as video, take cuts out of it and publish interviews, tweet out links to videos. That is a mechanism that should always exist try to do this as much as possible. Streamline thought creation process and expand how you can use that content to a bunch of platforms. It helps to have a set process and organization – "when we record a podcast, then we do x, y, z". #marketing #leverage #Strategy
You owe the audience everything (29:15). [[Anthony Pompliano]] spends a ton of time going through comments and responding. Often fairly safe, canned responses and emojis. Occasionally, you give a detailed thoughtful response. This gets the audience to become emotionally involved, and feel like they are involved and important. Not scalable, so he’s now at the point where he can’t respond to everything. The audience is why you can monetize, it’s the reason why you’re here. #engagement
Use spacing and punctuation – make it easier to read
Lists increase [[virality]] – super clear, digestible.
Links hurt [[virality]] – links are the exact oppostite, you have to click the link to get the information. Also, Twitter doesn’t want users to leave their platform. Put the content first and then the link later. Rather than sharing, actually talk about the top things you took away from the article and summarize things.
Hijack viral tweets / large accounts. [[Anthony Pompliano]] would put up alerts for big accounts like [[Donald Trump]] and he would race to respond as fast as possible. He would do something to get a lot of engagement, audience looks and checks out his profile. The big accounts are doing your marketing for you.
Reply to everyone
DMs are the real [[Linkedin]]. People are responsive, and there’s very few people on Twitter that have someone else running their account for them.
Set up your profile up for success. Where do you want people to go? Put the link in your profile. Write it out so people know the kind of content they’ll get. You can get tons of traffic on your profile if your tweeting gets lots of impressions.
Set a consistent schedule & don’t miss. People subscribe expecting something, so don’t miss. If you do a paid list like [[Substack]], focus on getting free people then converting them to paid, don’t focus on getting people immediately to paying. Most people want to window shop. You have to ease them in.
**Build your free list **- give more than you extract. You are in their inbox, so you better be sure you’re providing value.
Don’t be afraid to ask people to subscribe, whether it’s other social platforms or to your paid list. Know what you’re worth.
Find like-minded audiences & do link swaps. Figure out how to work with the people in those audiences. "If you like X, you’ll definitely like this thing Y I’m doing"
Identify "inflection points" and promote them in advance. Sometimes you know you’re going to be putting out something good. Rather than waiting until you publish, promote in advance: "on Monday, I’m writing something about X, if you want to read it, subscribe". After you publish it, say "I wrote something about X, if you want to read it, subscribe so you get more like this".
Use email as a distribution point for all content. In the bottom of the email, put links to all your other things – podcast episode of the day, sponsors. Just use a template and fill it in. Passive links pay off
Use the banner to explain what you cover and how often.
Don’t be afraid to ask people to subscribe.
Create more videos.
Optimize the video title, description, and thumbnail for SEO. [[YouTube]] is the second biggest search engine in the world. Look in [[Google Trends]] to see what people are searching for.
**Use the description for passive links **(link to all your other social platforms). Use that distribution you already have.
Pin the comment to top of comments with top link. Single best thing to do on YouTube if you want to promote other things. E.g. "pomp writes a daily letter to these kinds of people, here’s the link". Whatever you’re optimizing for, pin it at the top of the comment.
Create an outro with each video. That 15-20 second outtro can just be a pre-recorded clip and you just drop it in.
Authors with new books are always looking to promote their work
Record via Zoom to get audio and video
Good microphone and good lighting is important
Use micro content to promote individual episodes
Transcripts and show notes for SEO
"If you’re going to try this, make sure you are ready to dedicate hours a day for a decade". Just trying it sometimes or just doing one day a week – you will get frustrated, won’t build an audience. #persistence
Businesses of the future will build the customer base first and then build the product. When you write and build an audience you get feedback about what they want. As a result when you launch a product, you don’t have to pay for any advertising. #Strategy
Special thank-you to Andy Matuschak for pointing me to this paper.
You can download Roam Research Notes and an Anki flashcard deck I created for this research paper here.
Brief Overview of the Okita and Schwartz Paper
You have probably heard the advice that you should teach something if you really want to understand it. But does it really work, and if so, how?
Okita and Schwartz provide an extremely readable primer on the research behind Learning by Teaching and why it is so effective as a learning strategy.
They also explore a little-known benefit of learning by teaching called “recursive feedback” – feedback from watching your pupils use what you taught them. Using two separate experiments, Okita and Schwartz find that this special kind of feedback significantly improves teacher learning.
In this post, I summarize key insights from the paper on why learning by teaching works, and conclude with some thoughts on specific strategies for learning by teaching to improve your learning.
Why Learning by Teaching Works
Okita and Schwartz divide the learning by teaching process into three distinct phases: preparation (the teacher’s preparations to teach), teaching (the actual act of teaching), and observation (when the teacher receives recursive feedback by seeing the student apply what they learned from the teacher). It turns out that each of these phases contribute to the teacher’s learning.
Preparing
Preparing to teach students helps teachers learn due to three main forces:
Motivation: Preparation introduces strong emotions and motivation to truly understand the material and do it justice. This includes a sense of responsibility, the anticipation of a public performance, and a desire to avoid embarrassment or “looking stupid”.
Generation: Preparing to teach involves a “generation effect“. The generation effect means that you remember information better when you generate it from your mind rather than passively reading it. Preparing to teach is generative because you have to frequently retrieve and elaborate on information from your memory as you think about how you are going to teach your students.
Meta-cognitive vigilance: Meta-cognition refers to an awareness of your own thoughts. It turns out that preparing to teach generates this kind of awareness through the teacher’s self-explaining and self-generated questions as they anticipate the needs and questions of their pupils. This, in turn, helps teachers identify areas where they have conflicting knowledge or incomplete understanding.
Teaching
Three main aspects of this phase helps teachers learn:
Explanation. The act of teaching involves explaining ideas to others. This leads to “explanation effects” that occur from explaining ideas rather than just receiving them.
Question answering. Students often have questions of their teachers, which can reveal gaps in the teachers understanding or encourage the teacher to extend their understanding. In fact, Okita and Schwartz cite a study by Roscoe and Chi (2007) that found “tutees’ questions were responsible for about two-thirds of tutors’ reflective knowledge-building activity”.
Physiological arousal. Anyone that has experienced public speaking knows that it is a very stimulating activity that focuses your mind. As you might expect, this kind of arousal and attention improves learning.
Observing
In this phase, the teacher receives recursive feedback by watching the student apply what they learned. You might think it’s obvious that feedback improves learning, but it turns out that’s not always the case.
For example, direct feedback, where a student tells a teacher directly how well they did, can be counterproductive because people often take this kind of feedback personally, leading to “self-handicapping, learned hopelessness, or social comparison”. When this happens, the recipient of the feedback tends to adopt attitudes like, “well, I guess I’m not the kind of person who’s good at math“. As a result, they give up or opt for an easier subject. As much as we all like to believe we would receive feedback objectively and use it to our advantage, our egos often get involved, whether we like it or not.
Thankfully, recursive feedback side-steps this issue. Since the teacher is not directly receiving feedback from the student, their egos are uninvolved. Instead, they see for themselves what worked and what didn’t. No one explicitly tells them, “this is where you need to improve, this is what you did wrong”. Okita and Schwartz note that this “creates an ego-protective buffer, because the pupil rather than the tutor takes the immediate responsibility for being wrong”.
I also believe recursive feedback helps build empathy skills. A lack of empathy, in my opinion, is often a major barrier to learning and self-improvement. Think of how many people you have encountered in schools or workplaces that have tried to explain something to you, but assume an unreasonable amount of knowledge, leave out critical bits of information, or explain things in ways that are otherwise unhelpful (e.g. using tons of jargon you’re unfamiliar with)? Often these people are very intelligent, and would be far more effective if they gained some empathy.
How can we use these lessons about Learning by Teaching to improve our own learning?
The main lesson I took away from the Okita and Schwartz paper is that Learning by Teaching is not just folk wisdom. It works. So, as learners, we should try to use it wherever we can. Here are some ideas:
Develop a course or become a tutor. If there is a topic you really want to master, and you have enough time and resources, you can run an online or in-person course. In addition to the learning benefits, you can make some side income.
Observe your students. To take advantage of recursive feedback, you need to be able to see your students apply their knowledge. Use tests, presentations, or projects to see what your students learned.
Keep it interactive. Interaction with your students means more questions from them and, as a result, more learning for you. Okita and Schwartz note “Tutoring sessions should be arranged to limit the natural tendency of tutors to slip into didactics, which can eliminate opportunities for pupils to ask questions“. Students will often ask useful questions that help you better understand the material.
Write online. Writing online is a form of teaching, whether it’s blog posts, twitter, email newsletters, or something else. It also provides ample opportunity to receive valuable feedback about your work.
Develop a smart and interesting following. The quality of pupil questions impacts teacher learning. This means that, if you have an email list or a blog, or some other kind of online following, you learning would benefit from attracting high-quality people. Check out David Perell’s work on writing online, where he emphasizes the importance of writing for intelligent readers and leveraging their feedback to improve yourself.
Encourage your students to keep in touch about the projects they work on and how they applied the knowledge you taught them. Your students will appreciate this, and you’ll also get valuable recursive feedback.
Build things and watch people use what you’ve built. Okita and Schwartz point out that recursive feedback applies to areas other than Learning by Teaching. For example, producing products, tools, crafts, art, and then getting recursive feedback by observing how your “customer” uses it. One application of this idea that comes to mind is Agile software methodology, which relies on building software quickly, getting feedback on it as soon as possible, and constantly iterating and improving based on that feedback. If you produce something that others consume, you’ll gain by watching them use it.
My friend Harpreet Sahota just launched a new podcast called “The Artists of Data Science”. You can hear my interview here. We cover a variety of topics, including my path to becoming a data science, spaced repetition, compounding, finding good data science projects, the strangest question I’ve been asked in a job interview, and more!
Occasionally, special tools come along that amplify our minds, enabling new kinds of thought not otherwise possible. Computers, writing, speaking, and the printing press are all examples of these “Tools for Thought” that surge human potential.
This essay from Andy Matuschak and Michael Nielsen explores whether we can accelerate the development of these kind of tools. They also provide a taste of potential tools for thought with their prototype “mnemonic medium”, an interactive post on quantum mechanics called “Quantum Country” with embedded flashcards combined with a spaced repetition system delivered through email follow-ups.
Their essay is a must-read for anyone interested in spaced-repetition or productive learning. There are several points I found thought-provoking. I believe each of these insights indicate a need for a new Tool for Thought for flashcard development and sharing.
Spaced repetition creates exponential returns to studying
Based on Quantum Country user data, Matuschak and Nielsen estimate that devoting only 50% more time to spaced repetition after reading the essay resulted in users recalling the key points for months or years.
In other words, relatively small investments in spaced repetition after reading an article produces outsized results – more evidence to place on top of the mountain of research suggesting spaced repetition works.
Good flashcard development is difficult
Matuschak and Nielsen note that it takes a surprising amount of skill and time to build quality flashcards, especially for abstract concepts. This is probably a big reason why most people fail to adopt spaced-repetition tools like Anki. Since flashcard development is a skill that you develop over much time and effort, new users tend to add cards in a way that inevitably leads to frustration and failure.
This may partially explain the efficacy of Quantum Country: the authors are experts in both quantum mechanics and flashcard development – a rare but essential combination of skills for their essay to work.
Flashcards written by others can be useable
Some people the spaced repetition community don’t believe in using flashcards created by others, and with good reason. They’re often poorly written. They’re idiosyncratic. They’re missing crucial contextual information that you lack as someone who hasn’t read the original source material. I used to be one of these non-believers.
But the effectiveness of the Quantum Country essay suggests that shared flashcards can work well. This has benefits of saving users of the burden of flash card creation, as well as preventing new user frustration from poor flashcard building skills and poor domain knowledge.
Matuschak and Nielsen hypothesize that the quality of their flashcards is what makes this work. I agree, but I have a few more hypotheses:
Their flashcards are introduced in a logical progression as users read the essay. In contrast, shared decks in Anki shuffle cards randomly and are not encoded with dependency information.
Their flashcards are clearly connected to a source (i.e. the essay), providing important context for the user.
Users learn the material before they review flashcards. This is in line with the common wisdom that flashcards don’t work if you don’t already understand the material – they are a tool for retention, not learning. Aside: is this common wisdom true? I’m not so sure. Socrates taught using Q and A, so why can’t you teach a subject entirely with flashcards? If it is possible, what are the prerequisites to making it work?
Elaborative encoding
Matuschak and Nielsen note elaborative encoding as another learning tool shown to be extremely powerful in promoting memory. Essentially, it means connecting new ideas you want to remember with old ideas you know well, providing a fast path in your brain to new information.
Remember this concept while developing your flashcards. Whenever you add a new card, think about what you already know well and how you can connect this to the new knowledge.
A New Tool for Thought?
Matuschak and Nielsen’s article has renewed my interest in a tool for thought idea I’ve been pondering for quite a while: a platform for collaborative flashcards development and sharing. I believe such a tool, if properly developed, can address the issues that limit the use of spaced repetition:
Spaced repetition practitioners currently need to develop their own flashcards, which requires a significant amount of time, domain expertise, and flashcard-building skill. There needs to be a place where experts can create shared flashcards, and there should be a proper incentive structure encouraging creators to improve these flashcards over time.
Flashcards are not clearly connected to original sources. Spaced repetition practitioners should be able to pull up pre-built flashcards for a source document they are working through.
Current tools do not provide information that link flashcards together (other than knowing two flashcards are part of the same deck, or have the same tag). At the very least, flashcards should have a notion of “depends on” or “prerequisite to”. This would make shared decks more useful by showing the intended progression of knowledge. It would also aid elaborative encoding (e.g. examining cards you’ve reviewed and linking them up to cards “nearby” in a knowledge graph)
I strongly believe a tool like this needs to exist, as you may have guessed if you noticed the Download my Brain feature I built for this site that provides a platform for sharing my personal Anki decks. I have started work on a more generic tool for collaborative flashcard construction and sharing and will keep you posted once I have something ready for production.
Thanks to Andy Matuschak and Michael Nielsen for the inspiration to follow this path.
Ways to take advantage of this powerful and often-overlooked force for improvement
Ever wonder how successful people reach such heights? Think of a wildly successful person you admire. How did they get there?
The typical answers are hard work, innate gifts (personality, natural ability) and luck. These factors play a role, but the most important factor is left out: they leverage the power of compounding.
What is Compounding?
For compounding to occur, only two things are required:
Growth: Something must be growing by some percentage each year
Time: The growth process happens over multiple years
You’ve probably heard of a specific type of compounding: compound interest. In this context, compounding means that growing your money by some percentage every year eventually snowballs into huge results if you give it enough time.
For example, say you are able to earn 7% per year on your money. That doesn’t sound like a lot: if you invest $1000, that’s $70 in a year. Seems pretty modest.
Yes, you’ll earn $70 in year one, but in year 2 you earn $70 (7% of $1000) plus 7% on the $70 of additional money in your account that grew from year 1. As time passes, that 7% per year pumps out bigger and bigger piles of cash:
In Year 10: You’ve doubled the size of your account ($1,967)
In Year 20: You’ve quadrupled the size of your account ($3,870)
In Year 30: Your account is now almost 8 times your original investment of $1,000 ($7,612)
One lesson from this exercise is to save and invest some of your money. Your future self will thank you.
Another lesson is the earlier you start, the better. More years means more opportunity for exponential growth.
But there’s an interesting corollary to this exercise that is less obvious, and much more exciting: compounding isn’t just something that happens to your bank account – it applies to many other areas of life.
“We’re all sort of blundering fools, but if you just get some rate of improvement and let it keep compounding, you can do pretty well…You always want to be on some sort of curve where you’re compounding.”
All you need for compounding is growth and time – there is nothing about dollars or bank accounts mentioned in that definition. If you can get some percentage growth rate in some area of interest every year, you’ll eventually reach heights you never dreamed possible.
Think about some area where you want to excel. As an example, let’s say you’re in sales. If you improved at sales 10% every year, you would be twice as good in 7 years, four times as good in 15 years ten times as good in 25 years, and seventeen times as good in 30 years. In any given year, you’re not making tremendous improvements, but over time persistence leads to tremendous outcomes.
Also, keep in mind that although 10% growth is a great rate for a bank account, who’s to say this is a good rate of growth for your sales career? Maybe a reasonable growth rate is much higher. If that’s the case, you can expect much more dramatic results.
I believe this is how extraordinary people like Elon Musk reach rarefied heights: achieving a high growth rate in an area (e.g. managing a private space company) through intense focus and then relentlessly persisting to maintain that high growth rate over many years.
4 Ideas for Better Compounding
There are lots of ways you can compound in an area you want to improve. Look for anything that 1) gives you growth by some percentage or 2) helps you maintain that growth over multiple years. Some of the obvious ideas here include reading, taking lessons, attending talks, working with a mentor, and just simply doing work in the area you want to compound.
That being said, I have a few other tips that can both increase your percentage growth rate (ideas #2 and #3) and ensure you stick to it over the years (ideas #1 and #4).
Idea #1 – Have a plan
The key to compounding is consistent, focused effort over multiple years. It’s hard to do that without being clear about where you want to improve. If you don’t have clear goals, you’ll forget them or lose discipline, stifling your compounding efforts.
So, I recommend writing down the areas you would like to compound over time. Check back on this list regularly (I check weekly) and make sure that every year you’re making some effort to improve your abilities by some percentage.
For example, here’s a list of areas I’m personally focused on compounding over time:
Data science
Statistics / math
Programming
Communication
Writing
Speaking
Sales / persuasion
Managing teams / project management
Personal brand / developing followers on my blog and email list
Health
Relationships
Cooking
Drumming
I keep a Google document of this list and keep track of specific things that I am doing within each category to propel myself forward.
Idea #2 – Use spaced repetition
You’ve probably had this experience: you read a book or take a course and you want to retain it and apply as much as you can. Inevitably, the precious knowledge slowly exits your mind and 6 months later it feels like you didn’t learn anything in the first place.
Spaced repetition is quizzing yourself on knowledge in increasing intervals of time. It’s extremely effective and time efficient. I have flashcards in my spaced repetition system that I just answered that I will not be quizzed on again in 2 years. This spacing allows you to hold tens of thousands of flashcards in your mind while only reviewing tens of flashcards a day.
I have been a long-time user of spaced-repetition tools for committing things to long-term memory. During my university years, I wrote cards in Supermemo for all of my courses, and it was the secret weapon to my performance. Today, I use Anki, and it continues to be a key tool for compounding my knowledge in data science and retaining the vast amount of information required for success in the field.
I’m so excited about spaced repetition, I even have a feature on my website that I built to share my data science Anki decks with the world, organized by source: Download my Brain! I’m also running a Spaced Repetition Newsletter that will provide the latest news and links related to Anki, tips on using Anki, and ideas related to spaced repetition and productive learning.
A commonplace book is similar to spaced repetition in that it’s a tool to help you retain more of the important things that you learn. It also provides you with a body of material you can draw from, which is particularly valuable if you are a writer.
I personally use my commonplace book system to hold long-form wisdom that doesn’t lend itself well to flash card quizzing.
Idea #4 – Use commitment contracts
Once you have a plan for compounding in your improvement areas, you need to follow-through with that plan. Over the years I’ve tried many strategies to help deal with this issue of staying motivated and sticking to a plan, and the most effective tool I’ve found are commitment contracts. I’ve used commitment contracts to read and write more than I ever have in the past, despite being busier than ever with a full time job and a 3-year-old at home.
Commitment contracts are agreements where you commit to doing something, and failing leads to actual consequences. For example, I have a commitment contract to spend a minimum number of hours each week on various areas of interest. I track my time during the week, report back each week, and if I’m below my target I’m penalized $5.
I have found this surprisingly effective, especially considering the low stakes. It doesn’t take much of a penalty to provide enough motivation to follow through with your targets. I think this may be tapping into our inherent loss-aversion: we are irrationally repulsed by a loss, much more than the size of the loss would indicate. Of course, you can make your failure penalties higher if you want, but I personally don’t find it necessary.
The specific tool that I use for commitment contracts is StickK. I highly recommend it.
Conclusion
I think these tips will help you out, but the most important point to remember is compounding only requires two things: growth and time. Growth ensures you make progress, and time is what allows you to reach heights you never thought possible. In any given year, you may not be making huge improvements, but over time your persistence leads to huge outcomes.
If you want to commit this article to long-term memory, download the Anki deck I put together for it here.
I made a speech based on this blog post that you can find here:
If you’re interested in spaced repetition and haven’t read it yet, Gwern Branwen’s essay is a fantastic review, including research into the benefits of testing, what spaces repetition is used for, software, and other observations. There are lots of resources here for people that want to know the research behind why spaced repetition works, including many studies on the effects of testing and the effects of spacing your learning.
Here are a few points I found most interesting in Gwern’s essay:
People underestimate the benefits of spaced repetition: Gwern references fascinating research on how students and teachers grossly underestimate how much better spaced repetition is compared to cramming for learning.
Spaced repetition as a tool for maintenance of knowledge, not gaining new knowledge: According to some of the research referenced in the essay, spaced repetition doesn’t teach you new skills or abilities. Rather, it just helps you maintain existing skills.
“Skills like gymnastics and music performance raise an important point about the testing effect and spaced repetition: they are for the maintenance of memories or skills, they do not increase it beyond what was already learned. If one is a gifted amateur when one starts reviewing, one remains a gifted amateur.”
I’m resistant to this idea that you can’t learn using flashcards. I agree if new flashcards are thrown at you randomly, then yes that is a very inefficient way to learn. But what if flashcards are presented to you in a specific order when you are learning them, and “advanced” cards are not shown to you until you’ve learned the prerequisite “beginner” cards? I don’t know the research on this, but this strikes me as potentially a better way to learn than reading, if the cards are formulated properly. To my knowledge, none of the spaced repetition tools out there (e.g. Supermemo, Anki) allow for this kind of “card dependency” – if you know of a tool that does this, let me know.
Tradeoff between lookup time and mental space: A key question that you have to ask yourself when using spaced repetition is what information should I add to my spaced repetition system? Why add anything at all to it when you can just look it up on the internet?
The answer is that lookup costs can be large, especially for information that you use a lot. Often when you want to apply your knowledge, there isn’t enough time to look it up, or the time to look-up impedes your thinking. An extreme example of this would be trying to recall an important piece of knowledge in a job interview – good luck pulling out your phone in front of the interviewer to get the right answer.
To figure out what to add, you have to strike a balance with the tradeoff between lookup costs and the cost of adding the item to your spaced repetition system and reviewing it. Gwern provides a 5 minute rule as a criteria for deciding what to add: if you think you’ll spend over 5 minutes over your lifetime looking something up or not having the knowledge in your head will wind up somehow costing you more than 5 minutes, then it’s worth it to add it to spaced repetition.
Idea – dynamically generated cards: Gwern offers some interesting ideas about the possibility of dynamically generated cards. For example, having a card that teaches multiplication by randomly generating numbers to multiply. Similar ideas apply to chess, go, programming, grammar, and more.
Whether you like it or not, you are faced with a barrage of decisions every day. Human beings are essentially decision machines, and the quality of your life hinges on these choices you make. The better you are at it, the better your life will be.
Some decisions are low stakes. Sometimes, the stakes are tremendous. What should I let my kids do? Where should I invest? Should I switch jobs? Should I ride my bike or take a car? Should I move to that neighbourhood? Should I reach out to the family member I haven’t talked to in ages? Should I cross the street?
It’s valuable to have a mental decision framework that guides you to increase your decision quality and decrease the stress of the process. It’s also valuable to be aware of some common decision-making traps to avoid.
The Framework
The mental framework I use for making decisions looks like this:
As you can probably tell, this mental framework is heavily influenced by economics (specifically, cost-benefit analysis which is a decision framework used by economists).
At the highest level, making a decision in this framework involves 3 steps:
Estimate the benefits
Estimate the costs
If the benefits outweigh the costs, do it. If not, don’t. When you’re choosing between multiple courses of action, pick the one with the highest benefit-to-cost ratio
Steps #1 and #2 each break down into understanding two sub-components: probability and impact.
Probability is the chance of the chance the benefit or cost happens
Impact is how good the benefit is or how bad the cost is if it happens
Higher probability or higher impact means you should place more weight on that benefit or cost.
Most of us probably use a similar framework in our heads without even knowing it, but spelling it out like this helps clarify tough decisions and exposes hidden flaws in our decision-making.
5 Common Decision-Making Failures
This model may seem simple at first glance, but it’s deceptively tough to apply. This is because we’re human beings, not computers or all-knowing gods. We will never come close to applying this decision-making model perfectly. But even though we’ll never reach perfection, there are many ways to improve.
Here are five common failures you can keep an eye out for.
Common Failure #1: Loss aversion
Loss aversion means that we tend to hate losses much more than we love gains. As a result of this tendency, you irrationally underestimate benefits and overestimate costs in your decision-making.
This leads to particularly skewed decisions when considering benefits that are huge, but low probability (in other words, high payoff but a chance of a “loss”).
For example, say you’re applying for a big grant and you estimate your probability of getting it is less than 5%. Many would instantly choose to not write the grant without giving a second thought because the chances are slim. It’s true that winning the grant is unlikely, the payoff is huge. Applying might still be worthwhile and shouldn’t be dismissed without consideration.
Or consider Elon Musk. When he started SpaceX, he didn’t say “well, the chance of building a profitable, successful space company is low, so let’s just forget it”. Instead, he thought “the probability of success with this company is only about 10 percent, but the upside if I’m successful is tremendous so I’m going to try”.
Always remember that the emotional toll of losing is often irrationally high and doesn’t represent the actual cost of losing.
Common Failure #2: Not valuing your time
I remember in university, there was occasionally a “free pancake day”. Students would line up out the door for them, waiting about an hour in line to get these “free” pancakes.
The pancakes are only “free” if you don’t value your time, which is a huge mistake.
I personally believe you should value your time at least as high as your equivalent hourly salary at work. You may disagree with that number, but the point is that it’s absolutely worth something. This was one of the key takeaways from my economics background and probably the best piece of advice I can give.
Common Failure #3: Focusing only on money and measurable things
We often ignore benefits or costs that are not monetary, and in general we have a difficult time considering things that are not easy to measure. Here are some difficult-to-measure areas where there are often huge costs or benefits:
Health and wellness (e.g “I could never ride a bicycle because it’s too dangerous”)
Relationships with loved ones (e.g. cutting ties with a family member over a $100 dispute)
Education, skills, and learning (e.g. “our company doesn’t have the skills to perform this core business task so let’s just contract it out”)
Culture / morale (e.g. “We can’t fire Sarah. Sure, she’s a toxic, unethical person and makes everyone in the office miserable, but damn is she ever good at making widgets!”)
Common Failure #4: Not considering the costs of inaction
No matter what you do, you are making a decision. Choosing to not do anything or to “not make a decision” is itself a decision. As a result, the benefits and costs of inaction must be considered alongside the benefits and costs of all other courses of action.
Common Failure #5: Ignoring hidden benefits and costs
Many benefits and costs are commonly ignored because they are less obvious. For example:
Transporting yourself by bicycle leads to improvements to your physical appearance, mood, strength, focus, and energy.
Many people think the cost of owning a home is just a monthly mortgage payment. Hidden costs include property taxes, maintenance, and insurance, among many other expenses.
Many people think the cost of driving a car is just the cost of gas. Hidden costs here include insurance, parking, and maintenance.
Keep an eye out for costs and benefits that may be lurking slightly under the surface.
Conclusion
Decisions are hard. You’ll never make perfect decisions, but if you have a solid mental framework at your side and have some awareness of common mistakes, you can get better. More importantly, you can relieve some stress and feel more confident that you’re doing the best you can with what you have.
If you want to commit this article to long-term memory, download the Anki deck I put together for it here.
You’ve been programming in Python for a while, and although you know your way around dicts, lists, tuples, sets, functions, and classes, you have a feeling your Python knowledge is not where it should be. You have heard about “pythonic” code and yours falls short. You’re an intermediate Python programmer. You want to move to advanced.
This intermediate zone is a common place for data scientists to sit. So many of us are self-taught programmers using our programming languages as a means to a data analysis end. As a result, we are less likely to take a deep dive into our programming language and we’re less exposed to the best practices of software engineering.
If this is where you are in your Python journey, then I highly recommend you take a look at the book “Fluent Python” by Luciano Ramalho. As an intermediate Python programmer, I’m the target audience for this book and it exceeded my expectations.
The book consists of 21 chapters divided into five broad sections:
Data Structures: Covers the fundamental data structures within Python and their intricacies. This includes “sequences, mappings, and sets, as well as the str versus bytes split”. Some of this will be review for intermediate Python users, but it covers the topics in-depth and explains the counterintuitive twists of some of these data structures.
Functions as Objects: Describes the implications of functions being “first class objects” in Python (which essentially means functions to be passed around as arguments and returned from functions). This influences how some design patterns are implemented (or not required to be implemented) in Python. First class functions are related to the powerful function decorator feature which is also covered in this section.
Object-Oriented Idioms: A dive into various concepts related to object-oriented python programming, including object references, mutability, and recycling, using protocols and abstract base classes, inheritance, and operator overloading, among other topics.
Control Flow: Covers a variety of control flow structures and concepts in Python, including iterables, context managers, coroutines, and concurrency.
Metaprogramming: Metaprogramming in Python means creating or customizing classes at runtime. This section covers dynamic attributes and properties, descriptors, and class metaprogramming (including creating or modifying classes with functions, class decorators, and metaclasses).
There are a few things I really liked about this book:
Advanced Target Market: There are lots of materials for Python beginners, but not nearly as many self-contained, organized resources that explain advanced material for intermediate users. This book helps fill that gap.
Lots of great recommended resources: Each chapter has a “further reading” section with references to resources to expand your knowledge on the topic. The author not only links to these resources, but provides a brief summary and how they fit into the chapter’s material. Working through some of these references will be my game plan for the next several years as I work to propel my Python skills further.
It’s opinionated and entertaining: The end of each chapter has a “soapbox” section providing an entertaining, informative, and opinionated aside about the subject. Reading this section feels like having a chat over a beer with a top expert of their field. It provides context and injects some passion into topics that can be dry. These opinionated sections are clearly quarantined from the rest of the book, so it never feels like the author’s personal tastes are pushed on you. I wish every programming book had a section like this.
It pushes your understanding. I thought I was quite knowledgeable about Python and expected to work through this book quickly. I was wrong – it was slow reading and I plan on doing another deep read-through in 2020 to absorb more of the material.
Chapter 1: The Python Data Model. Provides a background into the data model that makes Python such a great language to code, allowing experienced Python programmers to anticipate features in new packages / APIs before even looking at the documentation.
Part 2: Data Structures
Chapter 2: An Array of Sequences. Sequences includes strings, bytes, lists, tuples, among other objects and are one of the most powerful concepts in Python. Python provides a common interface for iteration, slicing, sorting, and concatenating these objects and understanding the sequence types available and how to use them is key to writing Pythonic code.
Chapter 3: Dictionaries and Sets. Dictionaries are not only widely used by Python programmers – they are widely used in the actual implementation code of the language. This chapter goes in-depth into the intricacies of dictionaries so you can make the best use of them.
Chapter 4: Text versus Bytes. Python 3 made some big changes in its treatment of strings and bytes, getting rid of implicit conversion of bytes to Unicode. This chapter covers the details to understand Python 3 Unicode strings, binary sequences and encodings to convert from one to the other.
Part 3: Functions as Objects
Chapter 5: First Class Functions. Python treats functions as first class objects, which means you can pass them around as objects. For example, you can pass a function as an argument to a function or return a function as the return value of another function. This chapter explores the implications of this power.
Chapter 6: Design Patterns with First Class Functions. Many of the design patterns discussed in classic design patterns books change when you’re dealing with a dynamic programming language like Python. This chapter explores those patterns and how they look in Python’s first class function environment.
Chapter 7: Function Decorators and Closures. Decorators are a powerful feature in Python that lets you augment the behaviour of functions.
Part 4: Object-Oriented Idioms
Chapter 8: Object References, Mutability, and Recycling. This chapter covers details around references, object identity, value, aliasing, garbage collection, and the del command.
Chapter 9: A Pythonic Object. A continuation of Chapter 1, providing hands-on examples of the power of the Python data model and giving you a taste of how to build a “Pythonic” object by building a class representing mathematical vectors.
Chapter 10: Sequence Hacking, Hashing, and Slicing. An expansion of the Pythonic Vector object built in Chapter 9, adding support a variety of standard Python sequence operations, such as slicing.
Chapter 11: Interfaces – From Protocols to ABCs. Building interfaces for a language like Python is typically different than C++ or Java. Specifically, Abstract Base Classes (ABCs) are less common in Python and the approach to interfaces is typically less strict, using “duck typing” and “protocols”. This chapter describes the various approaches to defining an interface in Python and food for thought about when to use each approach.
Chapter 12: Inheritance – For Good or For Worse. Subclassing, with a focus on multiple inheritance, and the difficulties of subclassing the built-in types in Python.
Chapter 13: Operator Overloading – Doing it Right. Operator overloading lets your objects work with Python operators such as |, +, &, -, ~, and more. This chapter covers some restrictions Python places on overloading these operators and shows how to properly overload the various types of operators available.
Part 5: Control Flow
Chapter 14: Iterables, Iterators, and Generators. The iterator pattern from the classic design pattern texts is built into Python, so you never have to implement it yourself. This chapter studies iterables and related constructs in Python.
Chapter 15: Context Managers, and else Blocks. The bulk of this chapter covers the with statement (and related concepts), which is a powerful tool for automatically building up a temporary context and tearing it down after you’re done with it (e.g. opening / closing a file or database).
Chapter 16: Coroutines. This chapter describes coroutines, how they evolved from generators, and how to work with them, including an example of using coroutines for discrete event simulation (simulating a taxi fleet).
Chapter 17: Concurrency with Futures. This chapter teaches the concept of futures as “objects representing the asynchronous execution of an operation”. It also focuses on the concurrent.futures library, for which futures are foundational concept.
Chapter 18: Concurrency with asyncio. A dive into the asyncio package that implements concurrency and is part of the standard library.
Part 6: Metaprogramming
Chapter 19: Dynamic Attributes and Properties. In programming languages like Java, it’s considered bad practice to let clients directly access a class public attributes. In Python, this is actually a good idea thanks to properties and dynamic attributes that can control attribute access.
Chapter 20: Attribute Descriptors. Descriptors are like properties since they let you define access logic for attributes; however, descriptors let you generalize and reuse the access logic across multiple attributes.
Chapter 21: Class Metaprogramming. Metaprogramming in Python means creating or customizing classes at runtime. Python allows you to do this by creating classes with functions, inspecting or changing classes with class decorators, and using metaclasses to create whole new categories of classes.
You can access an Anki flashcard deck I created to accompany Fluent Python here.
Here’s the situation: You’re doing a big data analysis in your Jupyter Notebook. You’ve got tons of charts and you want to report on them. Ideally, you’d create your final report in the Jupyter notebook itself, with all its fancy markdown features and the ability to keep your code and reporting all in the same place. But here’s the rub: most people still want Word document reports, and don’t care about your code, reproducibility, etc. When reporting it’s important to give people the information in a format most useful to them.
So you’ve got tons of charts and graphs that you want to put in the Word report – how do you keep the two in sync? What if your charts change slightly (e.g. changing the styling of every chart in your report)? You’re stuck copying and pasting charts from your notebook, which is a manual, time-consuming, and error prone process.
In this post, I’ll show you my solution to this problem. It involves the following steps:
Saving the chart images from Jupyter Notebook to your desktop in code.
Preparing your Word Document report, referencing the image names that you saved in your desktop in the appropriate location in your report.
Loading the images into a new version of your Word Document.
Saving Chart Images from Jupyter Notebook to your Desktop
The first step is to gather the images you want to load into your report by saving them from Jupyter Notebook to image files on your hard drive. For this post, I’ll be using the data and analysis produced in my “Lets Scrape A Blog” post from a few months ago, where I scraped my favourite blog Marginal Revolution and did some simple analyses.
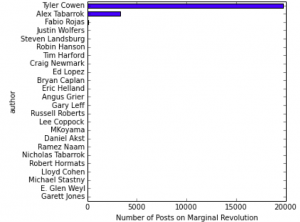
That analysis used matplotlib to produce some simple charts of results. To save these images to your desktop, matplotlib provides a useful function called savefig. For example, one chart produced in that analysis looks at the number of blog posts by author:
The following code produces this chart and saves it to a file named ‘num_posts_by_author_plot.png’ in the folder ‘report_images’.
Make sure you give your images useful, descriptive names. This helps ensure you place the proper reference in the Word document. I personally like following the convention of giving the plot image the same name as the plot object in your code.
Your images must have unique names or else the first image will be overwritten by the second image.
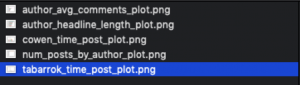
To stay organized, store the images in a separate folder designed specifically for the purpose of holding your report images.
Repeating similar code for my other charts, I’m left with 5 chart images in my report_images folder:
Preparing the Word Document Report with Image References
There is a popular Microsoft Word document package out there for Python called python-docx, which is great library for manipulating Word Documents with your Python code. However, its API does not easily allow you to insert an image in the middle of the document.
What we really need is something like Jinja2 for Word Docs: a packages where you can specify special placeholder values in your document and then automatically loads images in. Well, luckily exactly such a package exists: python-docx-template. It is built on top of python-docx and Jinja2 and lets you use Jinja2-like syntax in your Word Documents (see my other post on using Jinja2 templates to create PDF Reports).
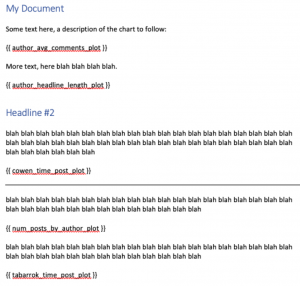
To get images into Word using python-docx-template, it’s simple: you just have to use the usual Jinja2 syntax {{ image_variable }} within your Word document. In my case, I had six images, and the Word template I put together for testing looked something like this:
For the system to work, you have to use variable names within {{ }} that align with the image names (before ‘.png’) and the plot variable names in your Jupyter notebook.
Loading the Images Into your Document
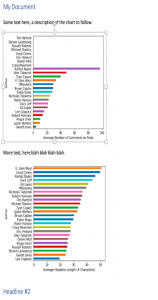
The final and most important step is to get all the images in your template. To do this, the code roughly follows the following steps: load your Word document template, load the images from your image directory as a dict of InlineImage objects, render the images in the Word document, and save the loaded-image version to a new filename.
To run the code, you need to specify the Word template document, the new Word document name which will contain the images, and the directory where your images are stored.
python load_images.py <template Word Doc Filename> <image-loaded Word Doc filename> <image directory name>
In my case, I used the following command, which takes in the template template.docx, produced the image-loaded Word Document result.docx, and grabs the images from the folder report_images: